
Do you have any goals for 2017?
Of course you do! And so do we.
In fact, one of our biggest goals for 2017 is to:
Establish Z Coast Media as the premier web design agency for businesses and teams in Atlanta with a focus on branding, content, and community.
Pretty broad and a bit lofty, right? It’s okay to say so. We know it is. But we like to dream big around here. We also like to ask questions.
And one of the questions we asked ourselves right around the beginning of the new year was how can social media help us achieve our vision?
Get your own Social Media Test Worksheet.
The awesome thing about social media is that there a lot of ways to measure your success. Whether you’re growing your community by acquiring new followers or boosting website traffic, the possibilities are endless.
Our Goals
All that possibility can be overwhelming at times. That’s okay! We understand the struggle. It’s not always easy to stay on track and focused. That’s why we decided to run a little test on Twitter over the last two weeks with some goals in place:
- Drive traffic to our site/blog and generate leads
- Grow brand awareness around Z Coast Media
- Build our community
While there was some planning involved, this test was run on what can basically be chalked up to a “Hey y’all, watch this” moment. For those of you who didn’t grow up in the Southeast, that means it was spur of the moment because we got an idea and got excited.
Sometimes, you just have let yourself have fun and go for it when you get an idea and that’s what we did. Our test started on January 8th and ended on January 21st.
Just for fun, we took a look at analytics from December 8th through December 21st compared to our test dates in January.
Before & After
December 8th, 2016 through December 21st, 2016 our Twitter efforts resulted in an average 797 impressions per day as you can see here thanks to Twitter Analytics:
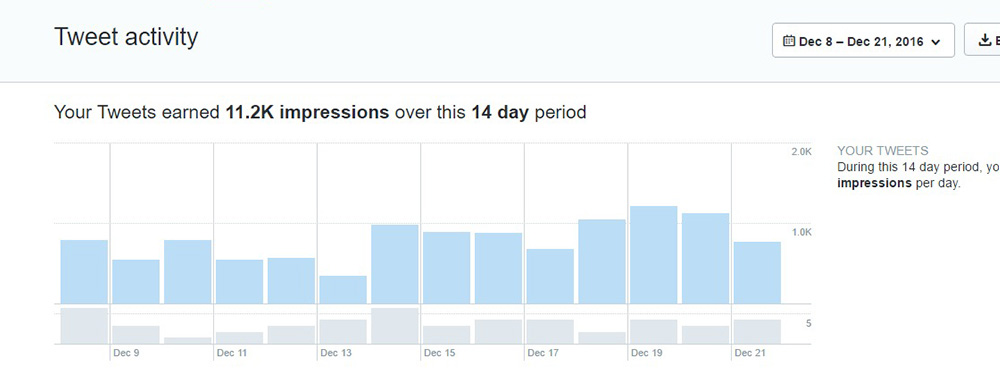
That works out to a total of 11.2k impressions over the 14 day period. Not bad, but we want more people to know who we are.
Now look at this graph but for the January 8th through January 21st dates:
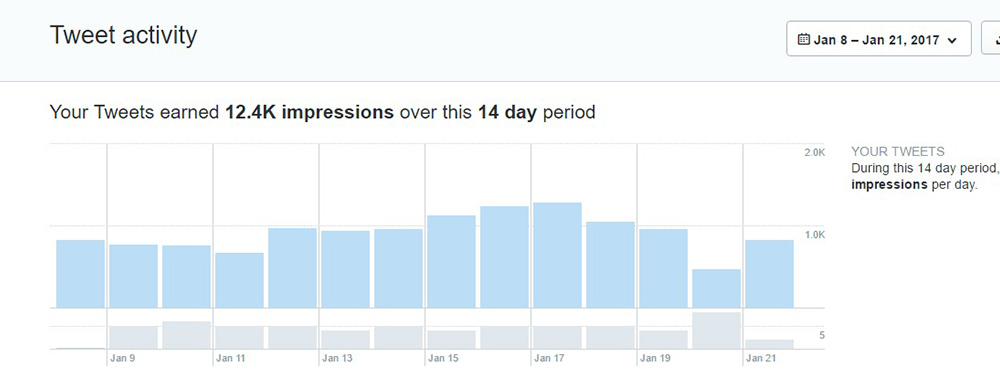
Comparing the two-week spans, our Tweets earned 1.2k more impressions in January than in December.
It’s not a huge jump or anything but you don’t have to be clearing canyons every other week to say you’re being successful. During our test, we saw an increase in impressions, engagement rate, link clicks, retweets, likes and replies.
Were any of these numbers huge? No. Did they increase from the numbers we were seeing in December? Yes. And that’s what’s important here! We weren’t dipping and we weren’t remaining stagnant. We improved.
One of our goals was to grow brand awareness with our little test and that’s what we did. Our follower base is growing, more people are seeing and engaging with our tweets, and more people are starting to mention Z Coast Media on Twitter.
Another one of our goals for this test was to increase traffic to our website/blog. Let’s turn to Google Analytics and look at what our network referrals looked like December 8th through December 21st, 2016:
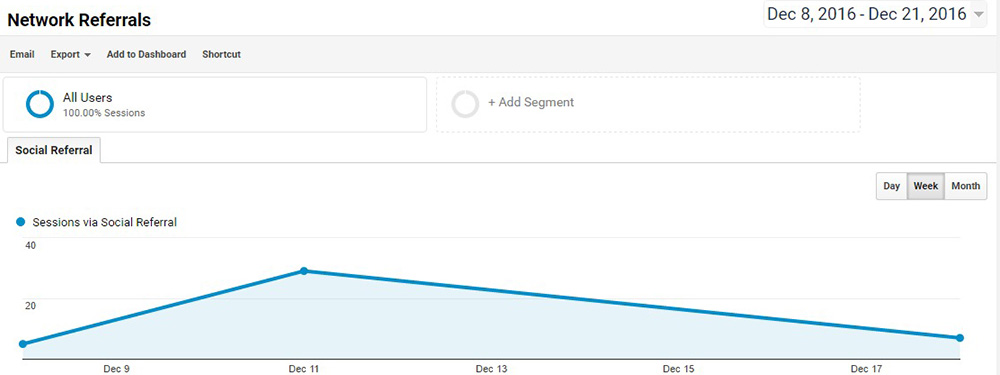
In case you’re blind, that graph is trending down. Not something we really want to see. Here’s the rest of the December Social Referrals report:
Not great. This is exactly why something had to change. So we ran our test (we’re going to tell you what we did, we promise!). Here’s the January Social Referrals graph:
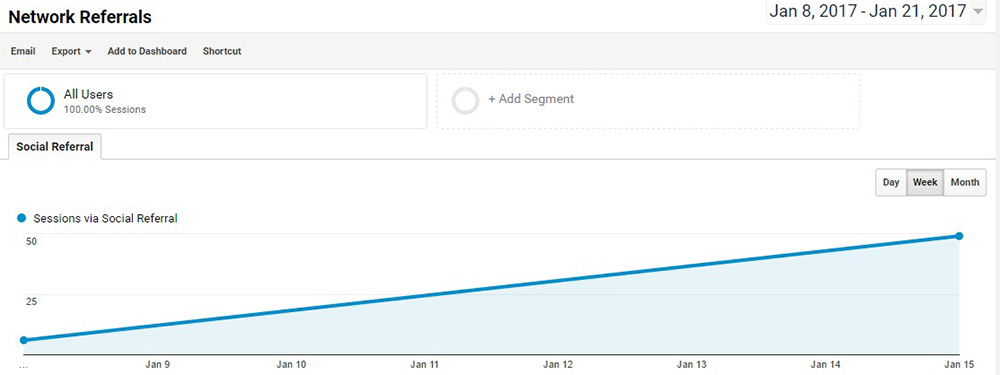
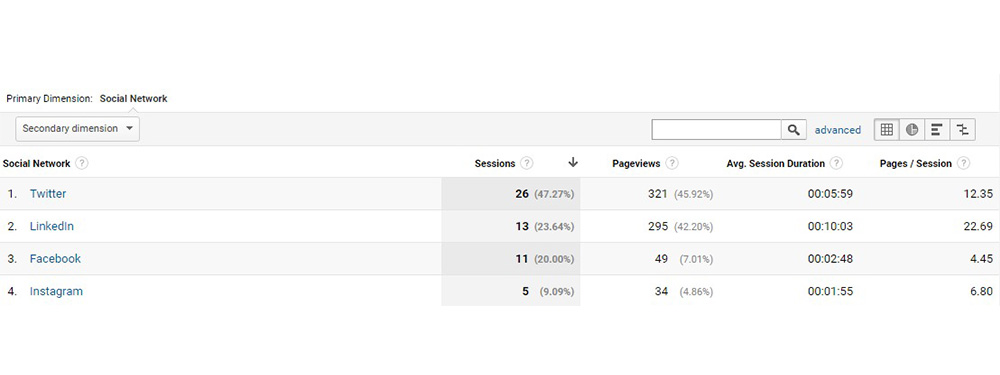
Now that’s what I’m talking about.Much better. That graph is going up, baby! And we’re pumped about it. And the rest:
Again, these numbers aren’t massive but the point of this post is to help you (and us) remember that just because you aren’t seeing “I went viral” numbers doesn’t mean you aren’t being successful. As long as you aren’t going backwards or frozen in place, you’re doing something right.
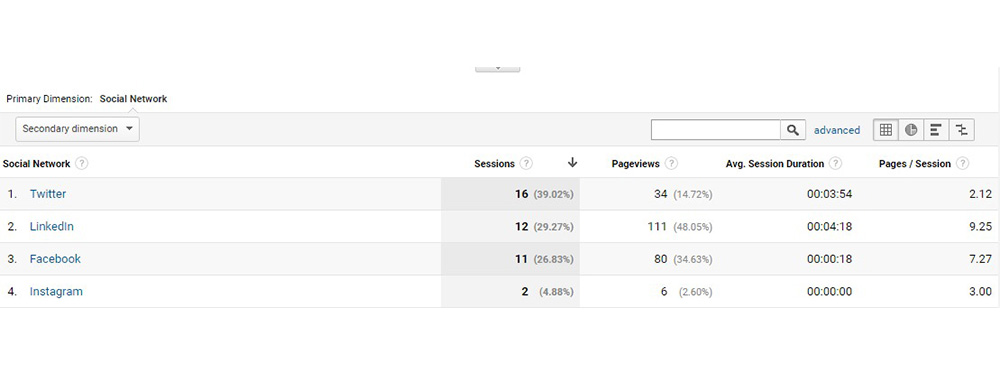
If you look at the December Twitter numbers:
- 16 sessions
- 34 pageviews
- 2.12 pages per session
Vs. the January Twitter numbers:
- 26 sessions
- 321 pageviews
- 12.35 pages per session
There’s a big difference in those numbers. A Good difference. We’ve seen a large increase in the number of pageviews and time spent on the Z Coast blog. In December, specifically December 8th through December 21st we saw these numbers:
- 143 pageviews
- 34 unique views
- Average time of 1 minute 11 seconds
But during our January test dates, January 8th through January 21st, we’ve seen those numbers increase to:
- 556 pageviews
- 47 unique views
- Average time of 2 minutes 4 seconds
We’re improving our ability to get the right information in front of the right people at the right time on social media. How are we doing it?
Two-Weeks of Trial & Error
Everything we do is trial and error. You’re never going to learn what works for your business and what doesn’t if you’re too afraid to try out your ideas.
To put it bluntly, you just have to suck it up and go for it if you want to be successful. It’s a success if something you try fails because now you know you need to try something else.
That’s what our little two-week social media test is all about. We said whatever happened, whether we saw results or not, we were going to consider the test successful because it would show us one of two things:
- The idea was good and showed us positive results
- The idea didn’t work
No matter what happened, we’d know what move to make going forward. If you’d like to run two-weeks of trial and error for yourself on Twitter, you’re welcome to give our method a try, it’s all laid out for you in this Two-Week Twitter Trial & Error Cheat Sheet.
If you do give it a try, we’d love to hear about the results of your test and what it did (or didn’t do) for your business. Call us, message us, Tweet us, Instagram us, whatever. We just want to know if you try it.


Leave a Reply
Want to join the discussion?Feel free to contribute!